Here’s a great summary of where the last 12 months’ electricity has been generated from, in terms of Wind, Solar, Nuclear, Gas etc. If you’d like to see how this compares to the current mix right now then click here
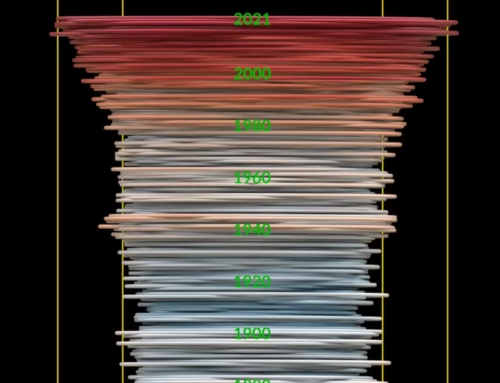
Immense thanks to Dr Andrew Crossland for allowing us to use these trackers. As you can see below he’s been tracking the UK’s CO2 emissions since 2016 and you can see the steady progress we are making to our 2030 target of reducing the 1990 CO2 emissions by 57%, and the legally binding target of net-zero emissions by 2050.

And click here to see an annual overview each year from 2012 to date.
If you enjoyed reading this, the please explore our other articles below: