
Welcome to Crondall Weather
Supplying live weather data and related weather statistics for Crondall since 2006

This website provides an ever changing source of weather information for Crondall, Farnham, Aldershot, Fleet and the surrounding areas.
The weather data is freely supplied and presented in various formats – drop us a note if you have a special need.
As well as providing general interest weather and updates for the local residents and gardeners, is also used :
The main raw live weather is supplied by a Davis Vantage Pro2 weather system, which is acknowledged as being one of the World’s leading systems (full specification in the tabs below). You can look at various options in our shop or simply click here to go straight to our recommended supplier.
In September 2019 a “Purple Air” air quality monitoring system was added, and in December 2020 a Weatherflow Tempest system to provide detailed Solar / UV / Sunshine data as well as Lightning strikes (within a 25 mile radius). Details are shown in the tabs below.
The site went live towards the end of January 2006.
Although we primarily service Crondall and the surrounding areas, we are actually visited from all over the world. Here’s the latest map:

And here’s our location in Crondall….
Crondall Weather
A Few Statistics
Weather Equipment Used to Collect Data
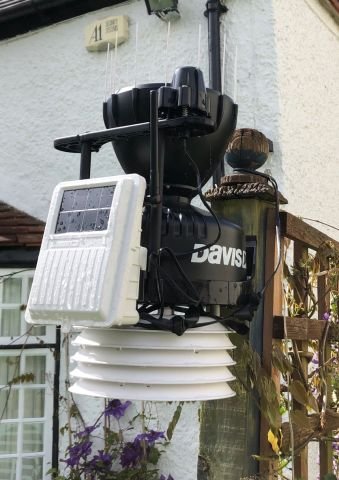
The rainfall collector and temperature / humidity / pressure measuring system is properly shielded and sited away from any major structures.
The reading should therefore be very accurate (although no guarantees or warranties can of course be given).
We have a variety of Davis weather stations available for sale here
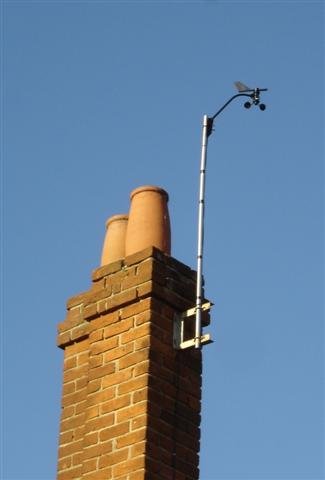
The anemometer is mounted above the roof line to give an unimpeded measurement of the wind.
Thankfully Robert Hill, chimney sweep extraordinaire (01252 – 621031), was available to properly orient and secure the securing brackets.
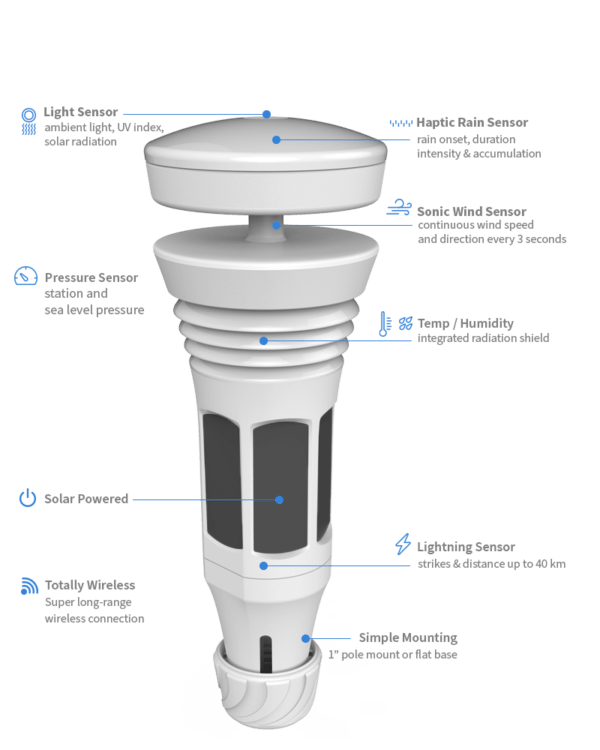
The Solar sensor in our Tempest Weather station measures solar radiation in Watts per square metre, UV index and the amount of sunlight.
This also allows (along with the anemometer and temperature/humidity sensor) us to monitor evapotranspiration to give a sense of how much water plants are needing each day.
The diffuser element and housing are carefully designed for accurate cosine response. Silicon photo diode provides good match to solar spectrum.
The two-piece housing minimizes radiation heating, allows convection cooling of the sensor, and prevents the trapping of water or dust.
We now have the Tempest available for sale here

The PA-II is an air quality sensor that measures real-time PM2.5 concentrations using PMS5003 and PMS1003 laser particle counters.
These sensors count suspended particles in sizes of 0.3, 0.5, 1.0, 2.5, 5.0, and 10um. These particle counts are processed by the sensor using a complex algorithm to calculate the PM1.0, PM2.5, and PM10 mass concentration in ug/m3.
It has a built-in WiFi which enables the air quality measurement device to transmit data to our site and also the PurpleAir map, where it is stored and made available to any smart device.
The latest data is available here and the overall map is here

AirLink accurately measures particulate matter for PM1, PM2.5, and PM10 to give you easy-to-understand graphs and color-coded Air Quality Index (AQI) reading based on inhalable particles that are small enough to penetrate deep into the lungs and enter the bloodstream.
Measures particulates as small as 0.3 micrometers with an accuracy of +/-10 micrograms per cubic meter in concentrations.
See updates on your phone and computer every minute.
Easily connect AirLink to your Wi-Fi network to send data to the Davis Cloud.
The latest data is available here

The lightning sensor in our Tempest device can detect strikes up to 40 km away, and while it does a good job at detecting many strikes in this range, it is far from 100% efficient. The closer the strike, the more likely the sensor will detect it, but it can miss-report strikes at any distance.
It can also be susceptible to nearby electromagnetic interference and sometimes it’s difficult for the algorithms onboard to tell if a strike is real or a “false positive”.
However, the data reported by the individual sensor in the Tempest is supported by additional data and a sophisticated back-end process that significantly improves the reporting of lightning. This is accomplished by comparing data from the Tempest with other nearby Tempests along with several trusted, third-party lightning data sources. The result is the best lightning strike data available.
Features
Strike Confirmation: Lightning strikes observed by a Tempest device are validated and processed normally.
False Strike Identification: When a strike from a particular Tempest device cannot be validated, it is flagged as a false positive (useful for quality control & analysis), and not reported.
Missed Strike Correction: If the combined additional data sources confirm a lightning strike near a Tempest that was not detected by the device, the system will fill in the gap with the validated strike information.
Key future developments to further enhance the weather statistics and reporting include:
Accuracy of Data
Temperature
Outside Temperature
Range. . . . . . . . . . . . . . . . . . . . . . . . . . . . . . . . . . . . -40° to +150°F (-40° to +65°C)
Sensor Accuracy . . . . . . . . . . . . . . . . . . . . . . . . . . . ±0.5°F (±0.3°C)
Radiation Induced Error (Passive Shield) . . . . . . . . . +4°F (2°C) at solar noon (insolation = 1040 W/m2, avg. wind speed 2 mph (1 ms)) (reference: RM Young Model 43408 Fan-Aspirated Radiation Shield)
Update Interval . . . . . . . . . . . . . . . . . . . . . . . . . . . . . 10 to 12 seconds
Humidity
Outside Relative Humidity (sensor located in ISS)
Resolution and Units. . . . . . . . . . . . . . . . . . . . . . . . . 1%
Range. . . . . . . . . . . . . . . . . . . . . . . . . . . . . . . . . . . . 1 to 100% RH
Accuracy . . . . . . . . . . . . . . . . . . . . . . . . . . . . . . . . . ±2%
Drift . . . . . . . . . . . . . . . . . . . . . . . . . . . . . . . . . . . . . <0.25% per year
Update Interval . . . . . . . . . . . . . . . . . . . . . . . . . . . . . 50 seconds to 1 minute
Rainfall
Resolution and Units. . . . . . . . . . . . . . . . . . . . . . . . . . . . 0.2 mm
Daily/Storm Rainfall Range . . . . . . . . . . . . . . . . . . . . . . . 0 to 99.99″ (0 to 999.8 mm)
Monthly/Yearly/Total Rainfall Range . . . . . . . . . . . . . . . . 0 to 199.99″ (0 to 6553 mm)
Accuracy . . . . . . . . . . . . . . . . . . . . . . . . . . . . . . . . . . . . For rain rates up to 10″/hr (250 mm/hr): ±3% of total or ± one tip of the spoon (0.01″/0.2mm), whichever is greater.
Update Interval . . . . . . . . . . . . . . . . . . . . . . . . . . . . . . . . 20 to 24 seconds
Storm Determination Method . . . . . . . . . . . . . . . . . . . . . 0.02″ (0.4 mm) begins a storm event, 24 hours without further accumulation ends a storm event
Rain Rate
Resolution and Units. . . . . . . . . . . . . . . . . . . . . . . . . . . . 0.1 mm
Range. . . . . . . . . . . . . . . . . . . . . . . . . . . . . . . . . . . . . . . 0, 0.04″/hr (1 mm/hr) to 30″/hr (0 to 762 mm/hr)
Accuracy . . . . . . . . . . . . . . . . . . . . . . . . . . . . . . . . . . . . ±5% for rain rates up to 10″/hr (250 mm/hr)
Update Interval . . . . . . . . . . . . . . . . . . . . . . . . . . . . . . . . 20 to 24 seconds
Calculation Method . . . . . . . . . . . . . . . . . . . . . . . . . . . . . Measures time between successive tips of tipping spoon. Elapsed time greater than 15 minutes or only one tip of the rain collector constitutes a rain rate of zero.
Barometer
Resolution and Units. . . . . . . . . . . . . . . . . . . . . . . . . . . . 0.01″ Hg, 0.1 mm Hg, 0.1 hPa/mb (user-selectable)
Range. . . . . . . . . . . . . . . . . . . . . . . . . . . . . . . . . . . . . . . 16.00″ to 32.50″ Hg, 410 to 820 mm Hg, 540 to 1100 hPa/mb
Uncorrected Reading Accuracy. . . . . . . . . . . . . . . . . . . . ±0.03″ Hg (±0.8 mm Hg, ±1.0 hPa/mb) (at room temperature)
Sea-Level Reduction Equation Used. . . . . . . . . . . . . . . . United States Method employed prior to use of current “R Factor” method
Equation Source . . . . . . . . . . . . . . . . . . . . . . . . . . . . . . . Smithsonian Meteorological Tables
Equation Accuracy . . . . . . . . . . . . . . . . . . . . . . . . . . . . . ±0.01″ Hg (±0.3 mm Hg, ±0.3 hPa/mb)
Elevation Accuracy Required . . . . . . . . . . . . . . . . . . . . . ±10’ (3m) to meet equation accuracy specification
Overall Accuracy . . . . . . . . . . . . . . . . . . . . . . . . . . . . . . ±0.03″ Hg (±0.8 mm Hg, ±1.0 hPa/mb)
Trend (change in 3 hours). . . . . . . . . . . . . . . . . . . . . . . . Change 0.06″ (2 hPa/mb,1.5 mm Hg) = Rapidly Change 0.02″ (0.7hPa/mb, 0.5 mm Hg)= Slowly
Trend Indication . . . . . . . . . . . . . . . . . . . . . . . . . . . . . . . 5 position arrow: Rising (rapidly or slowly), Steady, or Falling (rapidly or slowly)
Update Interval . . . . . . . . . . . . . . . . . . . . . . . . . . . . . . . . 1 minute or when console BAR key is pressed twice
Wind
Wind Chill (Calculated)
Resolution and Units. . . . . . . . . . . . . . . . . . . . . . . . . 1°F or 1°C (user-selectable) °C is converted from °F rounded to the nearest 1°C
Range. . . . . . . . . . . . . . . . . . . . . . . . . . . . . . . . . . . . -110° to +135°F (-79° to +57°C)
Accuracy . . . . . . . . . . . . . . . . . . . . . . . . . . . . . . . . . ±2°F (±1°C) (typical)
Update Interval . . . . . . . . . . . . . . . . . . . . . . . . . . . . . 10 to 12 seconds
Source . . . . . . . . . . . . . . . . . . . . . . . . . . . . . . . . . . . United States National Weather Service (NWS)/NOAA
Equation Used . . . . . . . . . . . . . . . . . . . . . . . . . . . . . Osczevski (1995) (adopted by US NWS in 2001)
Variables Used . . . . . . . . . . . . . . . . . . . . . . . . . . . . . Instant Outside Temperature and 10-min. Avg. Wind Speed
Wind Direction
Range. . . . . . . . . . . . . . . . . . . . . . . . . . . . . . . . . . . . 1 – 360°
Display Resolution . . . . . . . . . . . . . . . . . . . . . . . . . . 16 points (22.5°) on compass rose, 1° in numeric display
Accuracy . . . . . . . . . . . . . . . . . . . . . . . . . . . . . . . . . ±3°
Update Interval . . . . . . . . . . . . . . . . . . . . . . . . . . . . . 2.5 to 3 seconds
Wind Speed
Resolution and Units. . . . . . . . . . . . . . . . . . . . . . . . . 1 mph
Range. . . . . . . . . . . . . . . . . . . . . . . . . . . . . . . . . . . . 0 to 200 mph, 0 to 173 knots, 0 to 89 m/s, 0 to 322 km/h
Update Interval . . . . . . . . . . . . . . . . . . . . . . . . . . . . . Instant Reading: 2.5 to 3 seconds, 10-minute Average: 1 minute
Accuracy . . . . . . . . . . . . . . . . . . . . . . . . . . . . . . . . . ±2 mph (2 kts, 3.2 km/h, 0.9 m/s) or ±5%, whichever is greater
Solar
Resolution and Units . . . . . . . . . . . . . . . . . . . . . . . . . . . . 1 W/m2
Range . . . . . . . . . . . . . . . . . . . . . . . . . . . . . . . . . . . . . . . 0 to 1800 W/m2
Accuracy . . . . . . . . . . . . . . . . . . . . . . . . . . . . . . . . . . . . . ±5% of full scale (Reference: Eppley PSP at 1000 W/m2)
Drift . . . . . . . . . . . . . . . . . . . . . . . . . . . . . . . . . . . . . . . . . up to ±2% per year
Cosine Response. . . . . . . . . . . . . . . . . . . . . . . . . . . . . . . ±3% for angle of incidence from 0° to 75°
Temperature Coefficient. . . . . . . . . . . . . . . . . . . . . . . . . . -0.067% per °F (-0.12% per °C); reference temperature = 77°F (25 °C)
Update Interval . . . . . . . . . . . . . . . . . . . . . . . . . . . . . . . . 50 seconds to 1 minute (5 minutes when dark)
Air Quality
Purple Air
| Laser Particle Counters | |
| Type | (2) PMS5003 |
| Range of measurement | 0.3, 0.5, 1.0, 2.5, 5.0, & 10 μm |
| Counting efficiency | 50% at 0.3μm & 98% at ≥0.5μm |
| Effective range (PM2.5 standard)* |
0 to 500 μg/m³ |
| Maximum range (PM2.5 standard)* | ≥1000 μg/m³ |
| Maximum consistency error (PM2.5 standard) | ±10% at 100 to 500μg/m³ & ±10μg/m³ at 0 to 100μg/m³ |
| Standard Volume | 0.1 Litre |
| Single response time | ≤1 second |
| Total response time | ≤10 seconds |
| Pressure, Temperature, & Humidity Sensor | |
| Type | BME280 |
| Temperature range | -40°F to 185°F (-40°C to 85°C) |
| Pressure range | 300 to 1100 hPa |
| Humidity | Response time (τ63%): 1 s Accuracy tolerance: ±3% RH Hysteresis: ≤2% RH |
Davis Airlink
Particulate Matter |
|
| Particle Range of Measurement | 0.3 to 1.0 um; 1.0 to 2.5 um; 2.5 to 10 um |
| Particle Resolution | 1 ug/m3 |
| Accuracy | ±10 ug/m3 |
| Update Interval | 1 minute |
Inside/Outside Relative Humidity
|
|
| Resolution and Units | 0.1% |
| Range | 0.1% to 100% RH |
| Accuracy | ±2% |
| Update Interval | 1 minute |
Inside/Outside Temperature
|
|
| Resolution and Units | Current Data: 0.1°C |
| Range | -40 to +60°C |
| Accuracy | ±0.3 C (typical) |
| Update Interval | 1 minute |
General Specifications
|
|
| Operating Temperature | −10°C to +60°C |
| Housing Material | Rugged ABS Plastic |
| Dimensions (Sensor Only) | 5.1 cm x 8.9 cm x 2.5 cm |
| Dimensions (Outside Use Cover) | 10.1 cm x 11.4 cm x 3.8 cm |
| Weight (Sensor Only) | 106 g |
| WiFi Frequency Range | US Models: 2412-2462 MHz, 802.11b/g/n EU/UK/USB Models: 2412-2472 MHz, 802.11b/g/n |
Last Updated on 2nd May 2026 : Originally published on 24th February 2016
If you enjoyed reading this, the please explore our other articles below:
Last Updated on 2nd May 2026 : Originally published on 24th February 2016