The latest weather synopsis showing the weather fronts and associated pressure is below – the image is updated very hour or so.
And if you prefer a more classical, static versions of the above we have a couple of options.
Firstly from the Ocean Prediction Centre
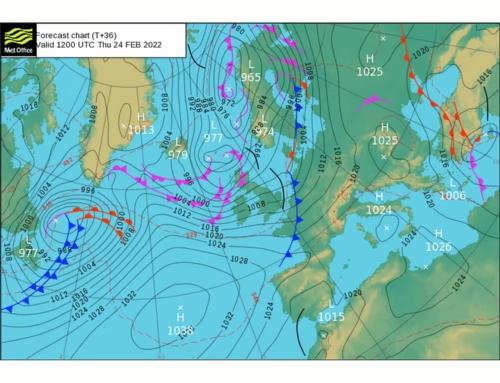
And if you prefer a more classical, static black and white version from the Met Office of how they see things developing over the next 24 hours:
The numbers measure the atmospheric pressure in millibars. Usually isobars are drawn at intervals of two or four millibars (one thousandth of a bar). The closer the isobars are together, the windier it is.
In general terms of the pressure is greater than 1013mb then we have high pressure and if it’s lower than that then we have low pressure.
If the lowest number is in the middle circle, this is a low pressure or depression. Often low pressures mean wet and windy weather.
If the highest number is in the middle circle, this is a high pressure or anticyclone. Often high pressures mean dry, sunny weather.
Air pressure tends to range from 890 mb (a hurricane) to 1060 mb (an anticyclone).
All the pressure numbers used by meterologists are converted to sea level or relative pressure to allow proper comparisons (actual air pressure falls the higher your altitude is). We have an article here which explains the difference between the two numbers (relative air pressure and absolute air pressure)
If you enjoyed reading this, the please explore our other articles below: