The AQI is an index for reporting daily air quality – click here to jump to the latest Crondall reading.
It tells you how clean or polluted the air is, and what associated health effects might be. The AQI focuses on health effects you may experience within a few hours or days after breathing polluted air.
The AQI consists of 5 pollutants:
The easiest way of measuring this is via Particulate Matter (PM) also known as soot, which consists of microscopically small solid particles or liquid droplets that can either be emitted directly into the air, or formed from secondary reactions involving gaseous pollutants that combine in the atmosphere.
PM is usually measured in two size ranges: PM10 and PM2.5.
PM10 refers to particles with diameters that are less than or equal to 10 microns in size (a micron, or micrometer, is one-millionth of a meter), or about 1/7 the diameter of a human hair
PM2.5, also called “fine particulates,” consists of particles with diameters that are less than or equal to 2.5 microns in size.
PM2.5 is a more serious health concern than PM10, since smaller particles can travel more deeply into our lungs and cause more harmful effects.
We are using 2 Air Monitors (details here) – one from Davis Instruments (who also supply our main Weather Station equipment) and one from Purple Air who have rapidly developed a worldwide network of devices.
Both work on a similar principle of using laser beams to detect the particles going past by their reflectivity, like dust shimmering in a sunbeam.
The PM 2.5 and PM 10 micro-gram weights are calculated from the counts.
The values are averaged every 20 seconds or so and the latest results from our Purple air monitor are shown below for the various time periods so you can get a sense of how the air quality is changing.
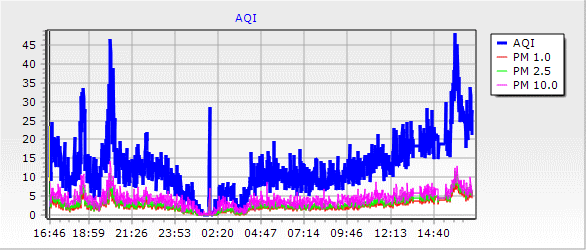
Here’s a summary graph of the last 24 hours – what’s also a bit frightening is how often the air quality spikes for the morning rush as so often Crondall is now being used as a cut through and is no longer the quiet village it used to be :(

Last 24 hours AQI and 2.5PM reading in Crondall
And in terms of the value right now from our Purple Air Sensor:
We also have a more detailed set of statistics here and you can see even more on a Google map here
Air Quality Definitions
Here’s the latest definitions based on the USA breakpoints in a handy summary provided by iqair.com

Air Quality Nowcast Measure
NowCast is an air quality data smoothing algorithm that puts an emphasis on recent values when the PM2.5 measurements are unstable or have been moving around a lot.
It is regarded as a more accurate representation of the Air Quality currently being experienced.
We use our Davis Airlink monitor to supply this data, and the current reading is:
To evaluate this value use the PM2.5 scales above.
Air Quality Forecast for the next 5 Days
We also supply data to the Vaisala weather network and return receive their own averaged Air Quality actuals and forecasts for Crondall and immediate surrounding area.
Is there a Common View on what AQI levels actually mean?
In short, the answer is no.
The USA led the way , and for this reason it is the USA charts and definitions that we are reporting as they are currently the most recognised standard.
However the UK government has recently issued guidance that is considerably lower than the numbers above for the more dangerous PM2.5 particles.
They have also decided to use a 1 to 10 scale, albeit with similar colour coding.

So as a reminder here’s the current Nowcast 2.5ppm reading
If you enjoyed reading this, the please explore our other articles below:


Hello,
with no safe limit frim the W.H.O for pm2.5, do you not think our government officials should be informing the public this information during a respiratory pandemic as of March/April 2020?
Many thanks
Lee
Thanks Lee,
Yes I agree, and this is one of the reasons why we invested in the air quality monitor kit and make the information freely available.
Kind regards
Neil