We’ve been collecting general weather data for Crondall since February 2006, but in late January 2020 added a solar sensor to allow us to start tracking sunshine hours, solar energy and Evapotranspiration.
Here’s an easy to view monthly overview of the Solar Kilowatt hours, so you can easily see the variations for the various months (and in time years), as well as scanning the months of any particular year.
As well as the monthly summary, if you’d like to see how each day breaks out within a particular year then select the “daily detail” radio button, and if you’d like to see how the various seasonal averages compare then select the “seasonal summary” radio button where we then summarise as follows:
Northern Hemisphere Meteorological Seasons
Winter: December, January, February
Spring: March, April, May
Summer: June, July, August
Autumn: September, October, November
If you’d like to see how the current month’s data for Temperature and Rainfall compares to the overall average then click here
And if you want to see Crondall’s all time station records for all weather statistics then please go here
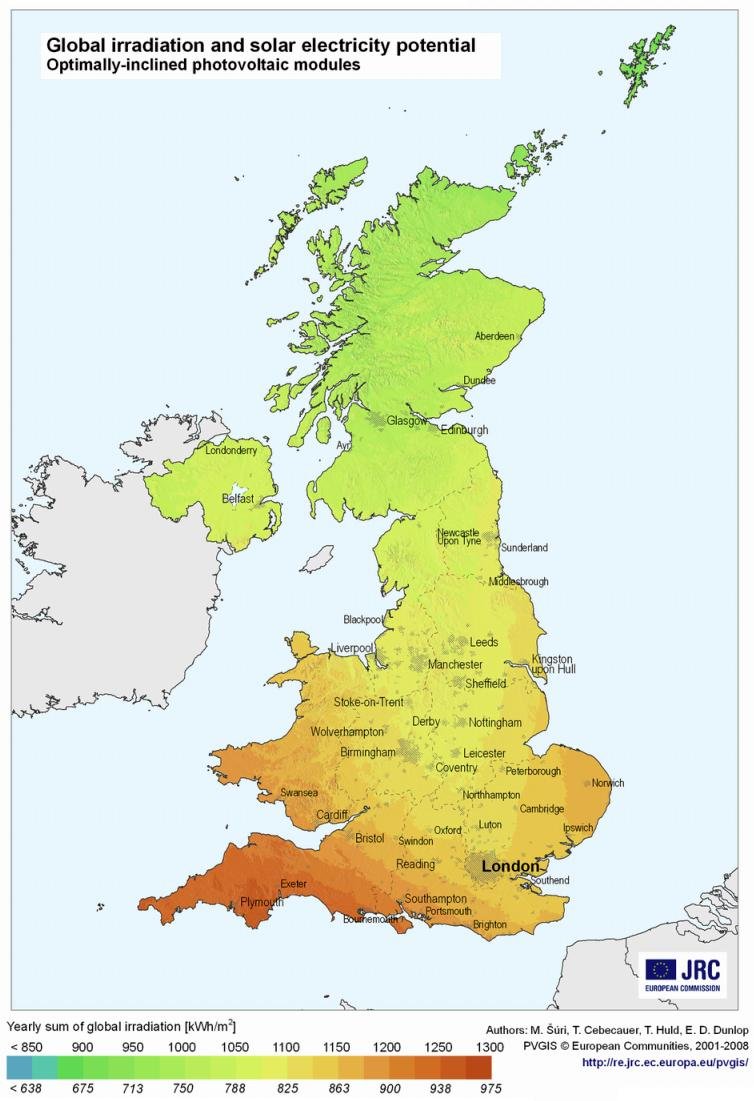
The amount of solar energy generated over a year is naturally dependent on your latitude location. For example areas in the South of England will typically generate around 30% more than the Shetland Isles. Here’s an excellent map which shows the solar generation potential variations throughout the UK
And if you’d like to see how successful the UK is at generating electricity for the National Grid we have a daily tracker here
If you enjoyed reading this, the please explore our other articles below:


