In meteorology, the 528 line is a crucial concept, especially when it comes to predicting winter weather.
This line, often seen on weather charts, helps meteorologists determine whether precipitation will fall as rain or snow.
But what exactly is the 528 line, and why is it so important?
What is the 528 Line?
The 528 line refers to a specific thickness level in the atmosphere, measured in decameters (dam).
Thickness in meteorology is the vertical distance between two pressure levels, typically the 1000 millibar (mb) and 500 mb levels. These levels correspond roughly to somewhere near the ground surface and roughly the middle of the troposphere, respectively.
The number 528 represents a thickness of 5280 meters (or 528 dam). This measurement is significant because it indicates the temperature of the air between these two pressure levels.
Cold air is denser and occupies less space, resulting in a lower thickness value. Conversely, warm air is less dense and occupies more space, leading to a higher thickness value.
Why is the 528 Line Important?
The 528 line is often used as a rule of thumb to predict snow.
When the thickness is 528 dam or lower, it generally indicates that the air is cold enough for snow to form. If the 528 line is positioned to the south of a location, it suggests that the area is likely to experience snow. If it is to the north, rain is more probable.
This line is particularly useful in regions like the UK, where predicting snow can be challenging due to the variability in weather patterns. The presence of the 528 line on a weather chart provides a quick visual cue for meteorologists to assess the likelihood of snow.
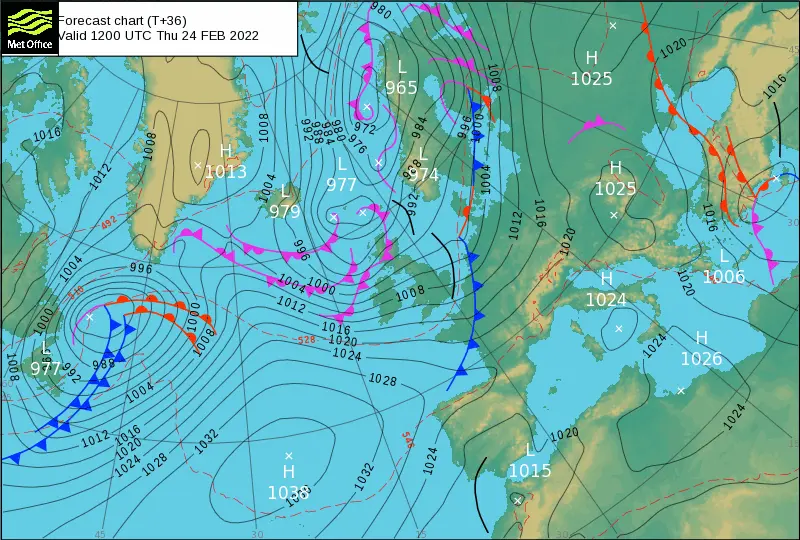
The chart above from the Met Office shows an example of the 528 line (shown in red) – and of course if you spot say a 510 line over the UK then get ready with your snow shovel.
How is the 528 Line Used in Weather Forecasting?
Meteorologists use weather charts that display isobars (lines of constant pressure) and thickness lines (lines of constant height).
The 528 line is one of these thickness lines. By examining the position of the 528 line relative to a specific location, meteorologists can make educated predictions about the type of precipitation that will occur.
For example, if a weather chart shows the 528 line running across the southern part of the UK, it indicates that the air mass over the region is cold enough for snow. Conversely, if the line is further north, the air is likely warmer, and rain is more probable.
The Science Behind the 528 Line
The concept of thickness is rooted in the principles of atmospheric science. The thickness between two pressure levels is influenced by the average temperature of the air in that layer. Warm air expands and becomes less dense, increasing the thickness. Cold air contracts and becomes denser, decreasing the thickness.
This relationship between temperature and thickness is why the 528 line is such a reliable indicator of snow.
When the thickness is 528 dam or lower, it means the air is sufficiently cold throughout the layer to support snow formation.
Practical Applications and Limitations
While the 528 line is a valuable tool for predicting snow, it is not infallible. Other factors, such as humidity, wind patterns, and local topography, also play crucial roles in determining the type of precipitation. Therefore, meteorologists use the 528 line in conjunction with other data to make the most accurate forecasts possible.
In summary, the 528 line is a key concept in meteorology that helps predict whether precipitation will fall as rain or snow.
By understanding the relationship between air temperature and thickness, meteorologists can use the 528 line to make more accurate weather forecasts.
While it is not a standalone predictor, it is an essential part of the meteorological toolkit, especially in regions where winter weather is highly variable
If you enjoyed reading this, the please explore our other articles below:


